Hello I'm Gustiyan Islahuzaman

Data Analyst who loves to solve problems with code and communicate results through visualizations @gustiyaniz.

Download cv

Hello I'm Data Analyst

Specializing in Power BI with a Bachelor's in Statistics. Skilled in Python, R, SQL, and Excel advanced (Power Query and Power Pivot), transforming complex data into insightful and interactive visualizations.

Download cv
About Me

Hello, I'm Gustiyan Islahuzaman from Purbalingga, Central Java, Indonesia. I hold a Bachelor's degree in Statistics from Diponegoro University with a GPA of 3.50.

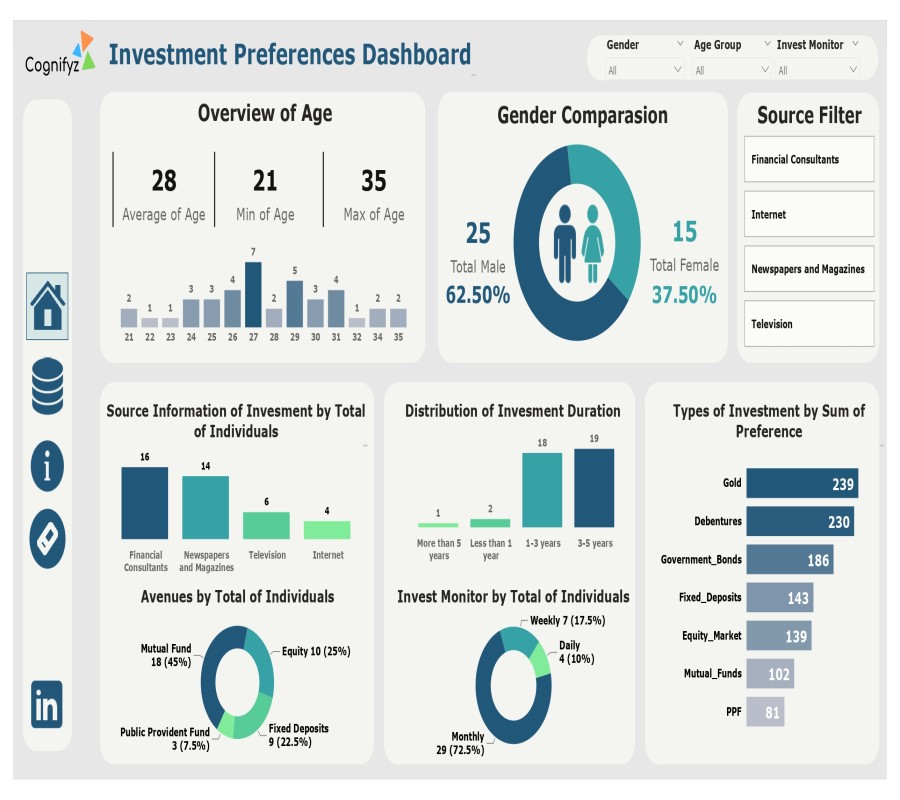
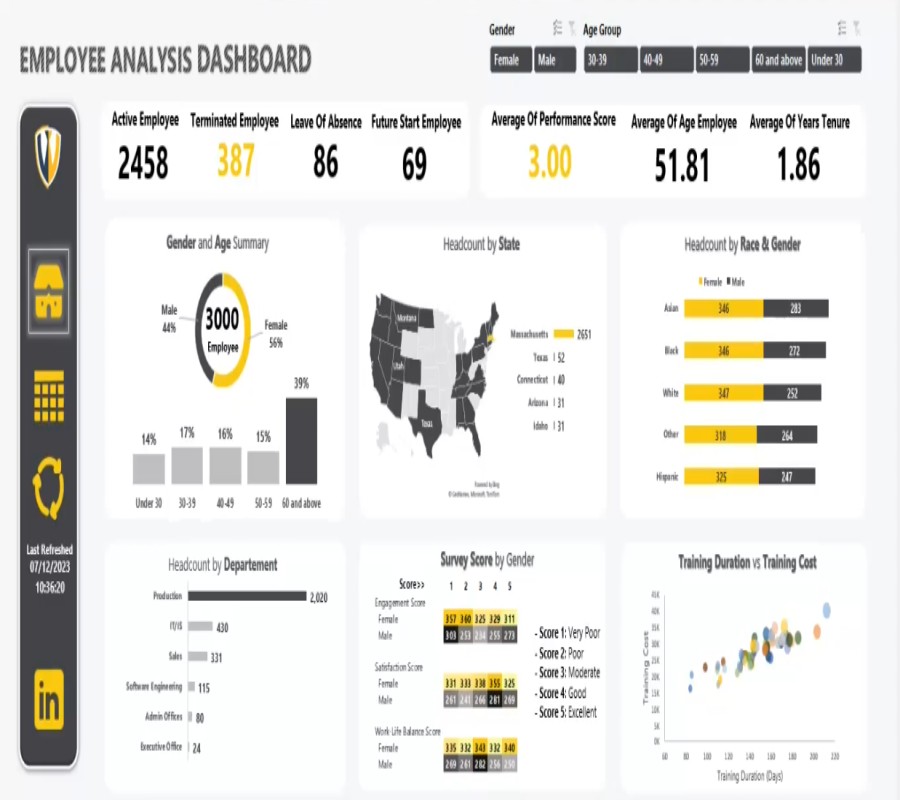
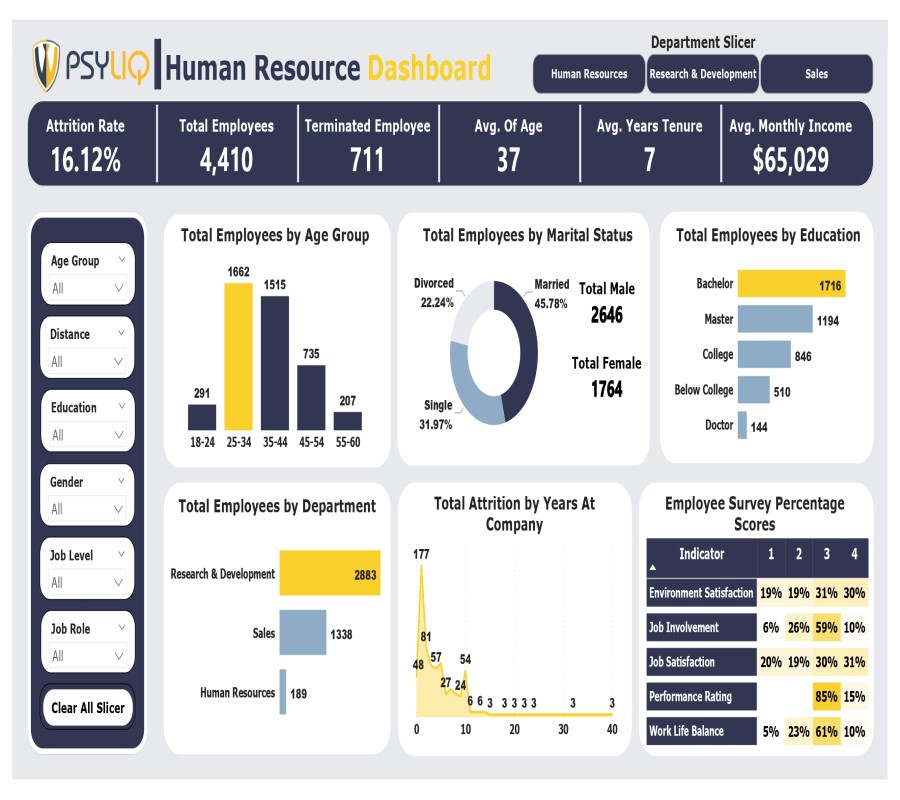
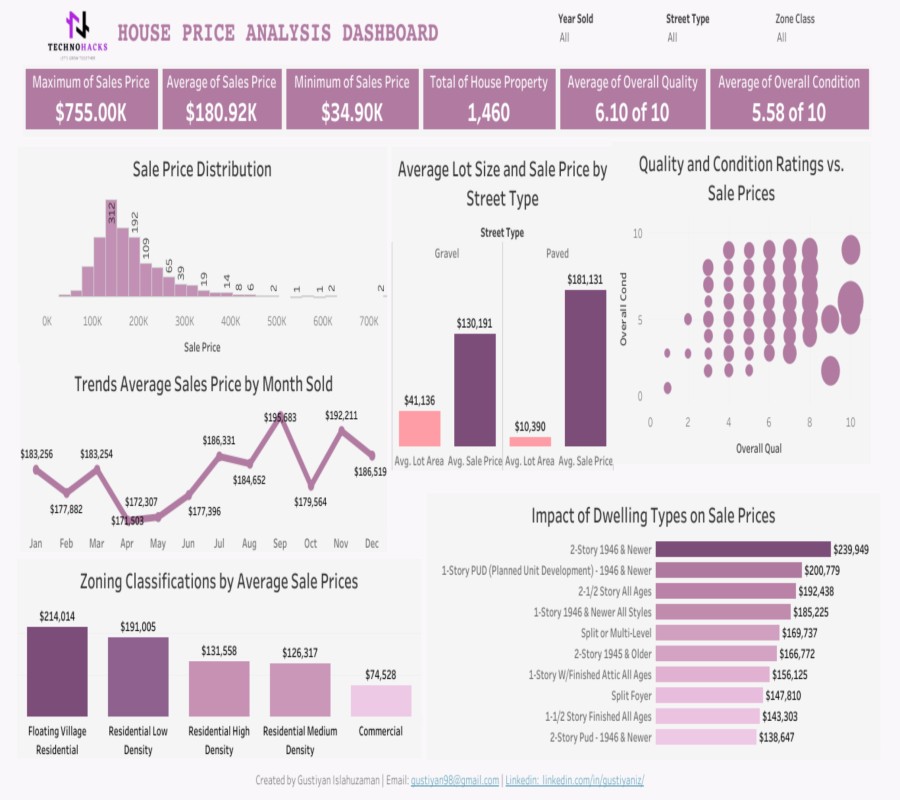
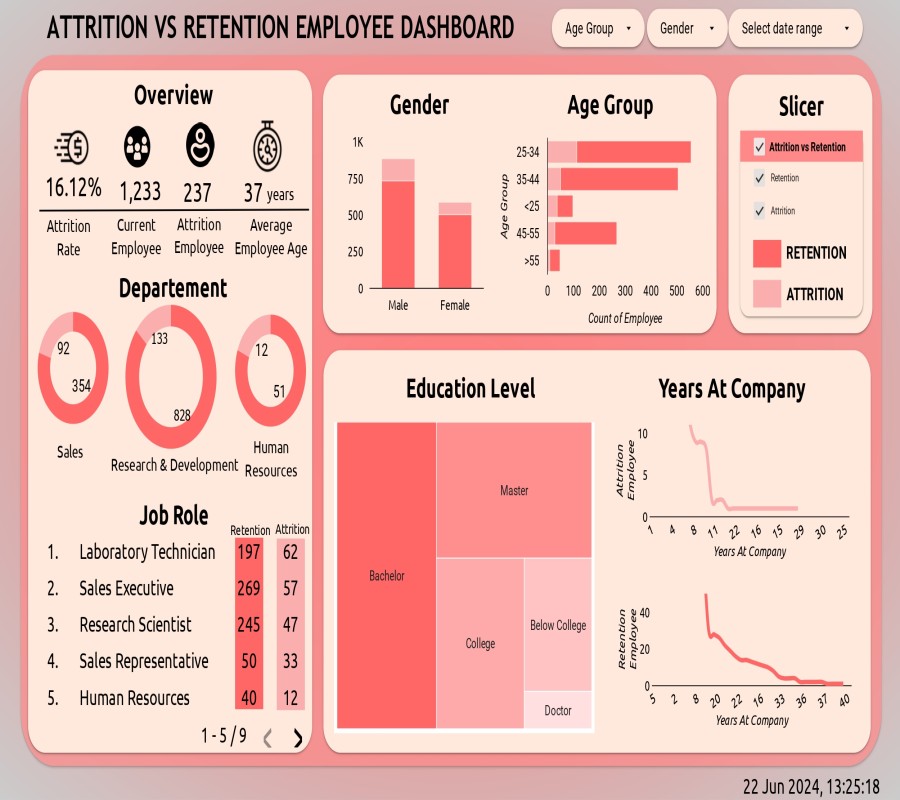
I have hands-on experience as a Data Analyst Intern at Psyliq, where I analyzed employee data using Excel and MySQL, and developed an interactive HR dashboard. At Cognifyz Technologies, I specialized in creating Power BI solutions, focusing on data cleaning, transformation, and visualization. During my time at Technohack Edutech, I worked with complex data sets, utilizing RStudio and Python for data preprocessing and developing dashboards with Power BI and Tableau.

I am proficient in R, Python, SQL, and advanced Excel (Power Query and Power Pivot). My skill set includes tools like RStudio, VSCode, DBeaver, Google Sheets, Google Colab, Power BI, and Looker Studio. I am passionate about transforming complex data into insightful, interactive visualizations to inform smarter decision-making processes.

  • Follow Me
Download cv

Services

Data Cleaning Icon

Data Cleaning and Preprocessing

Transforming raw data into clean, accurate, and usable formats to ensure high-quality analysis.

Data Visualization Icon

Data Visualization

Creating insightful and interactive visualizations using tools like Power BI and Excel to help stakeholders understand data trends and insights.

Dashboard Icon

Dashboard Creation

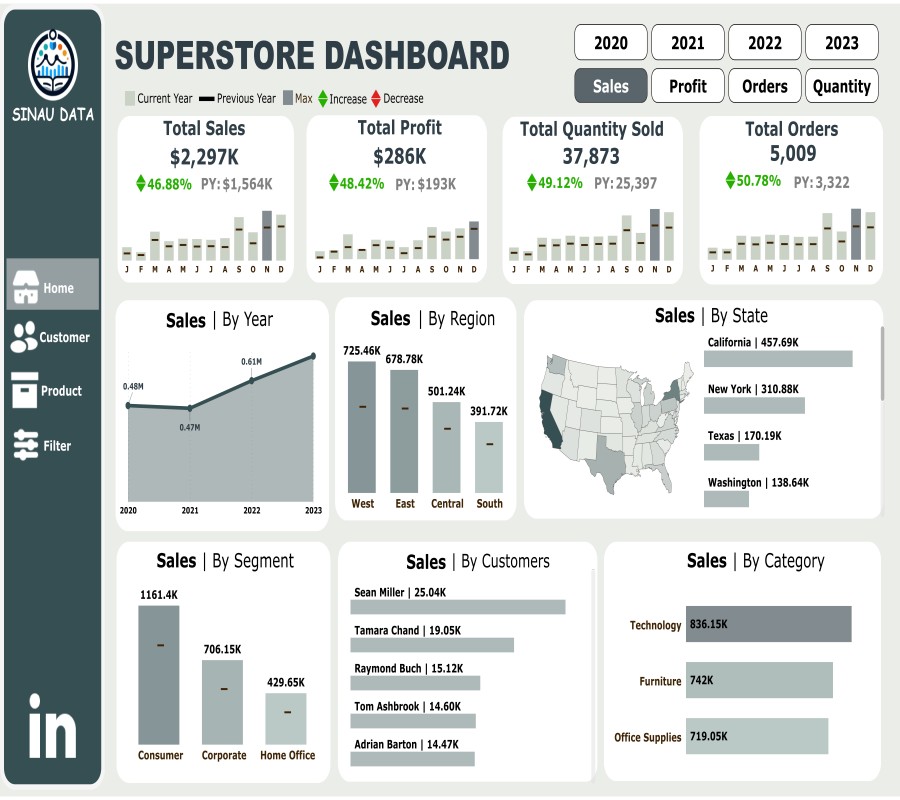
Designing and developing interactive Power BI, Looker Studio and Tableau dashboards to visualize complex data and provide actionable insights.

Data Modeling Icon

Data Modeling

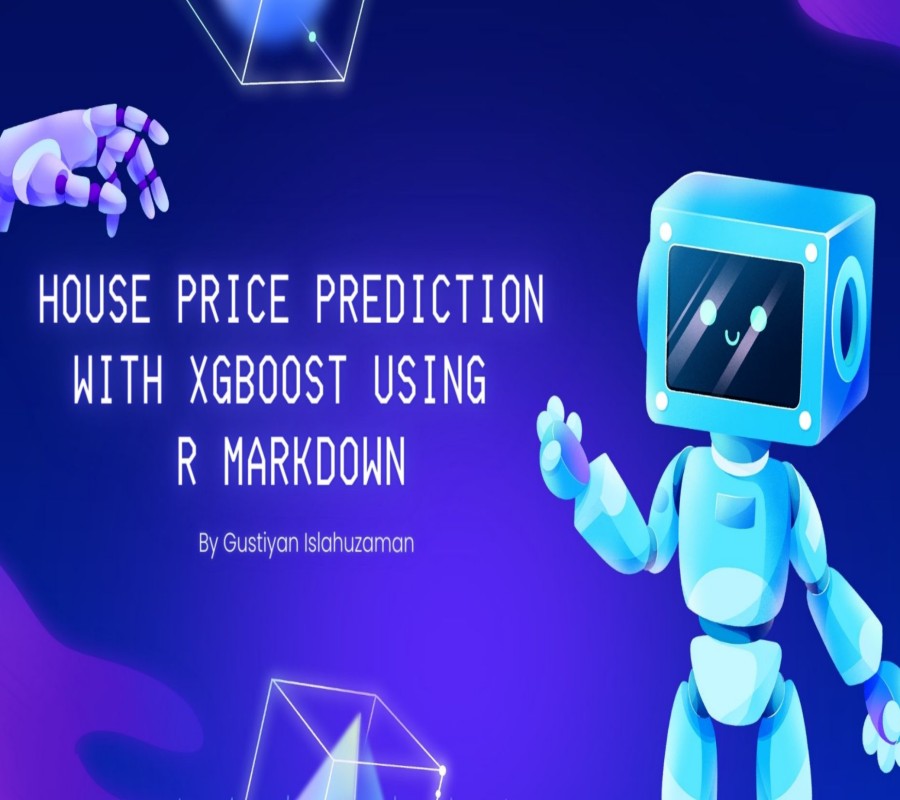
Building and validating predictive models using tools like R and Python to forecast trends and inform decision-making.

Database Management Icon

Database Management

Managing and querying databases using SQL (MySQL and Postgree SQL) to extract relevant data efficiently and accurately.

Statistical Analysis Icon

Statistical Analysis

Applying statistical methods and techniques to analyze data and uncover meaningful patterns and relationships.

Portfolio

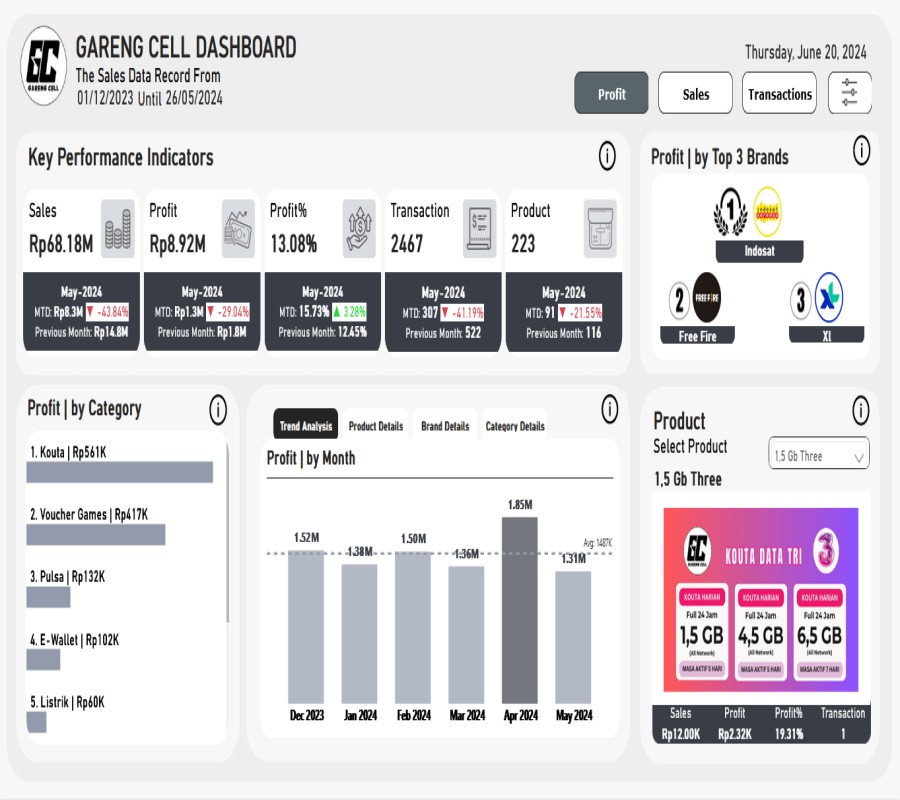
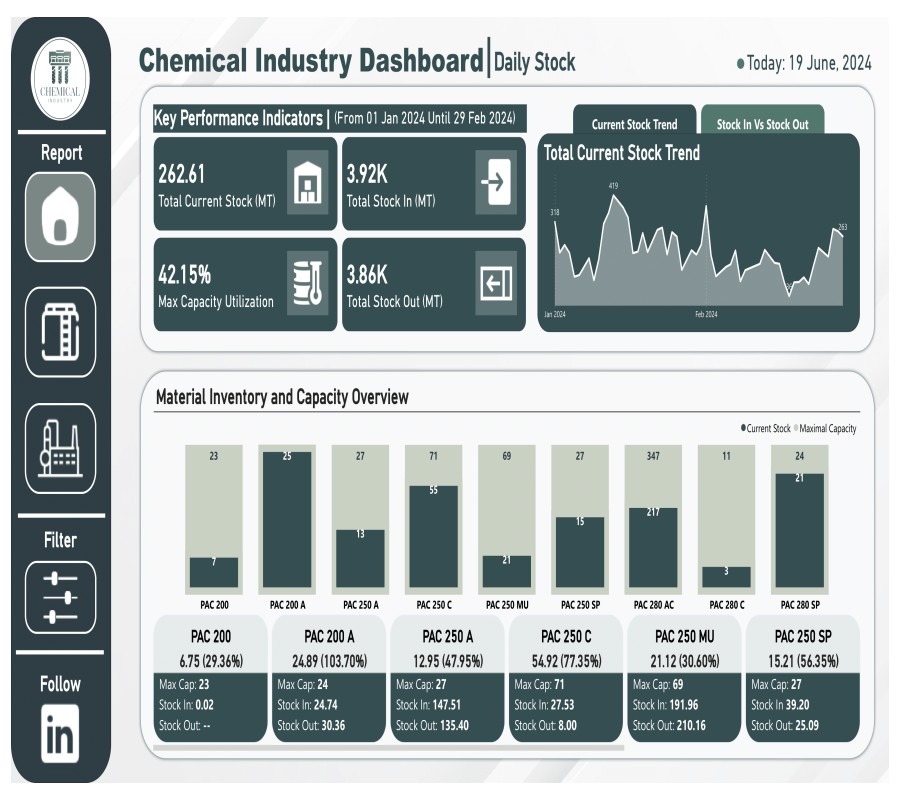
Take a look at my work in data analytics and visualization. Each project demonstrates my ability to uncover valuable insights from data.

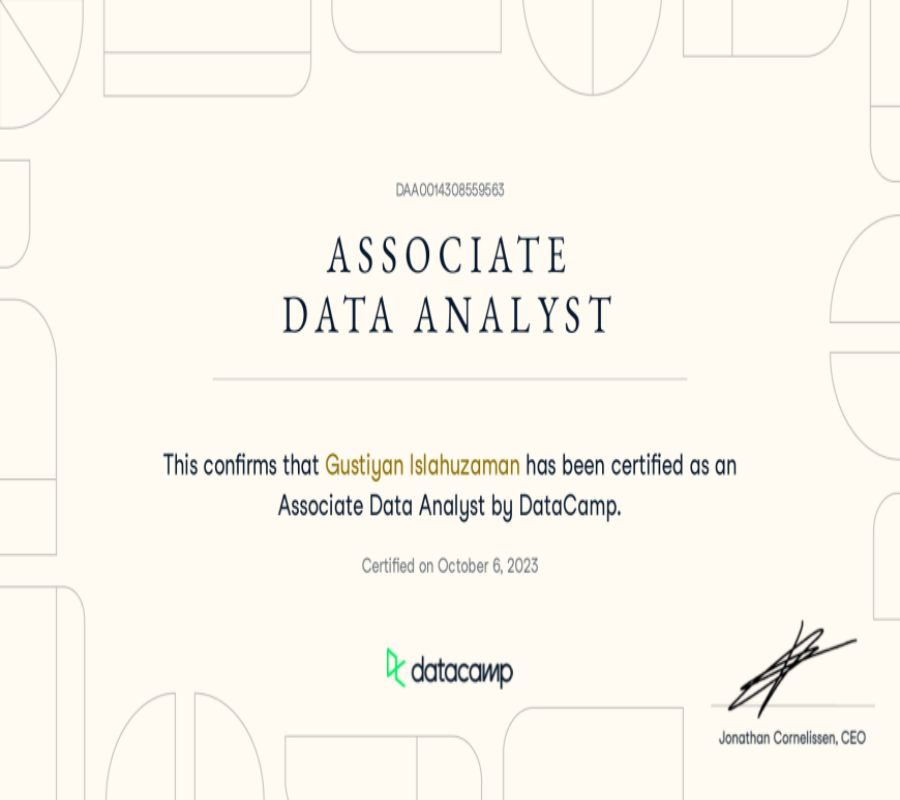
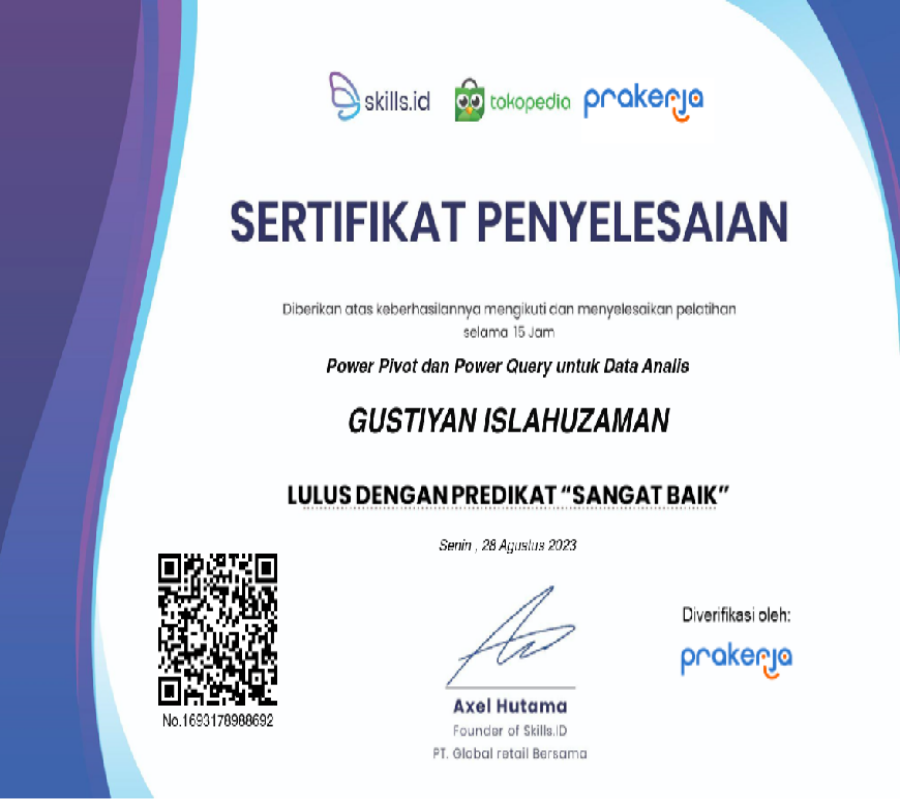
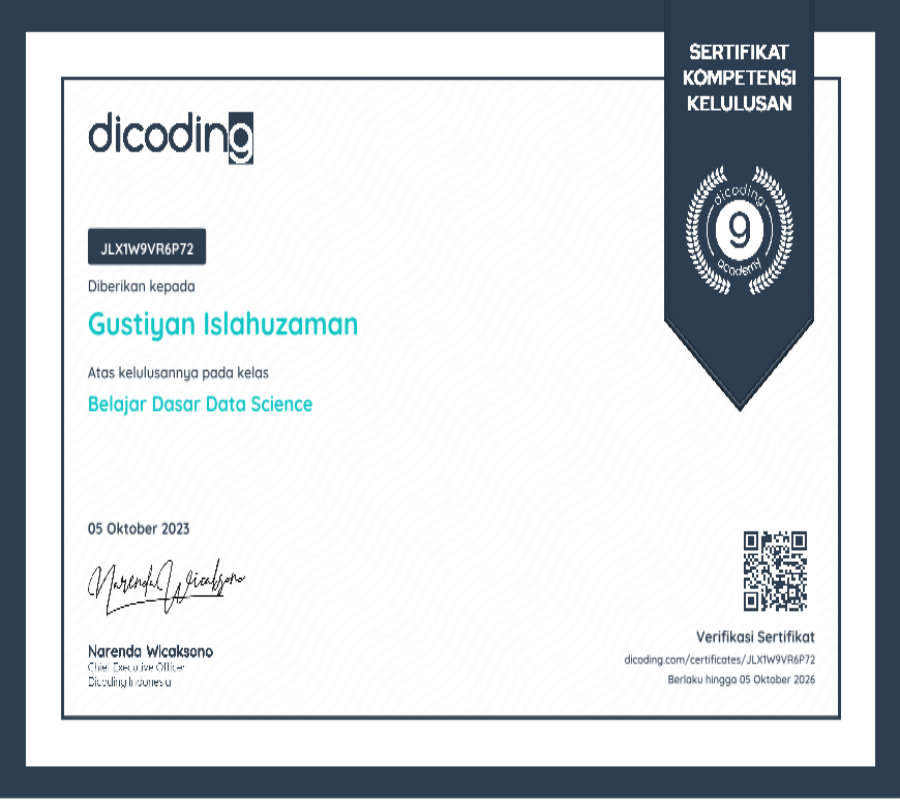
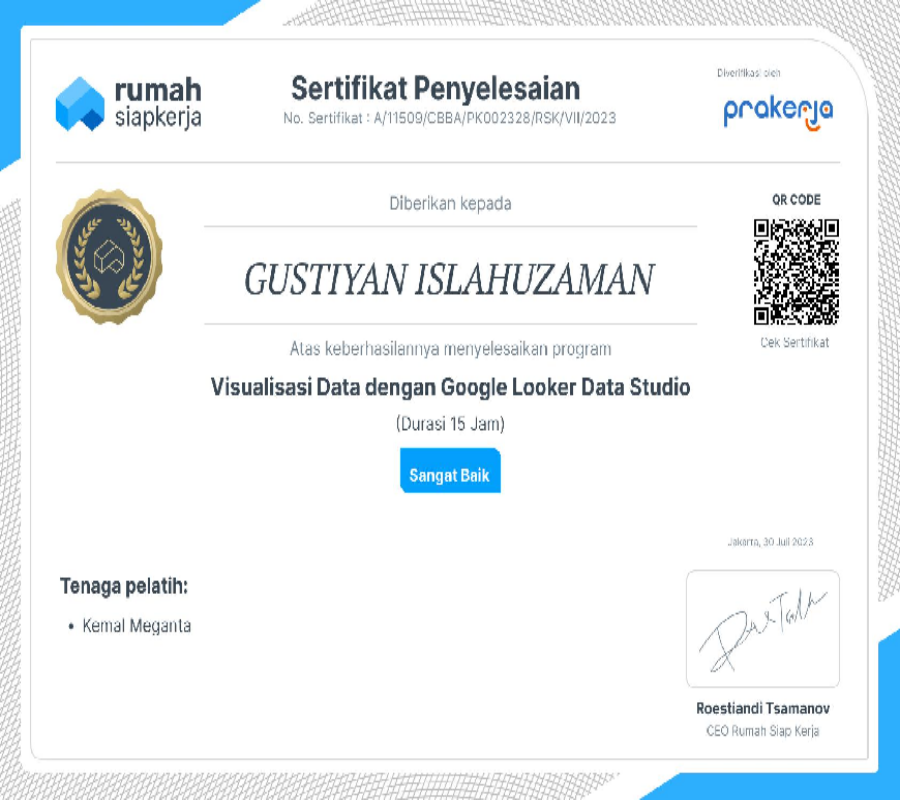
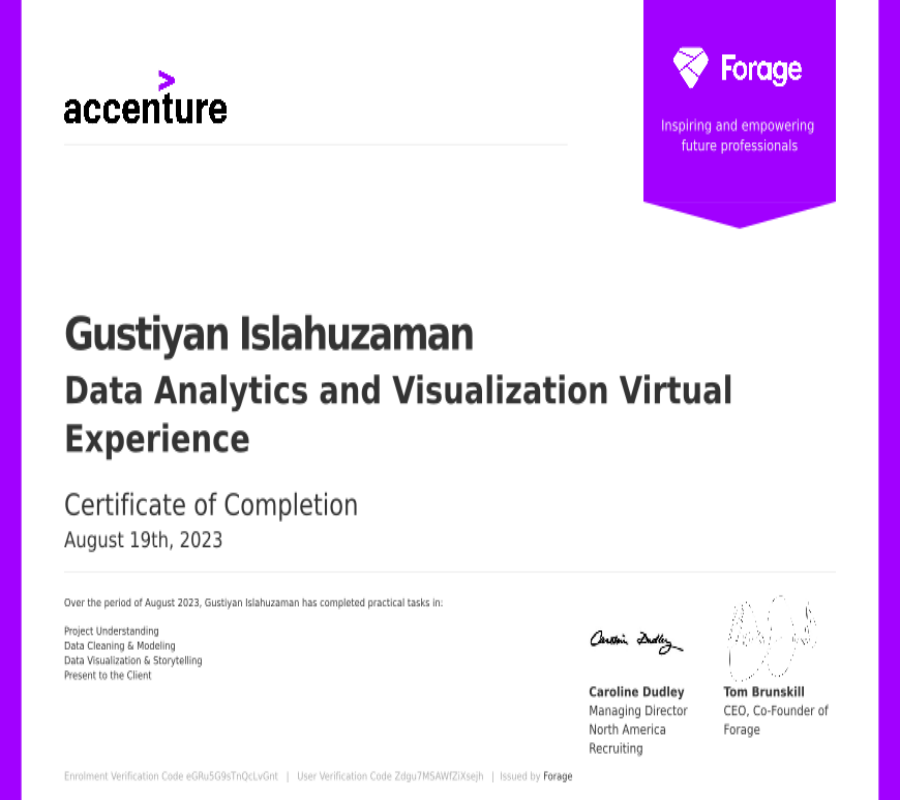
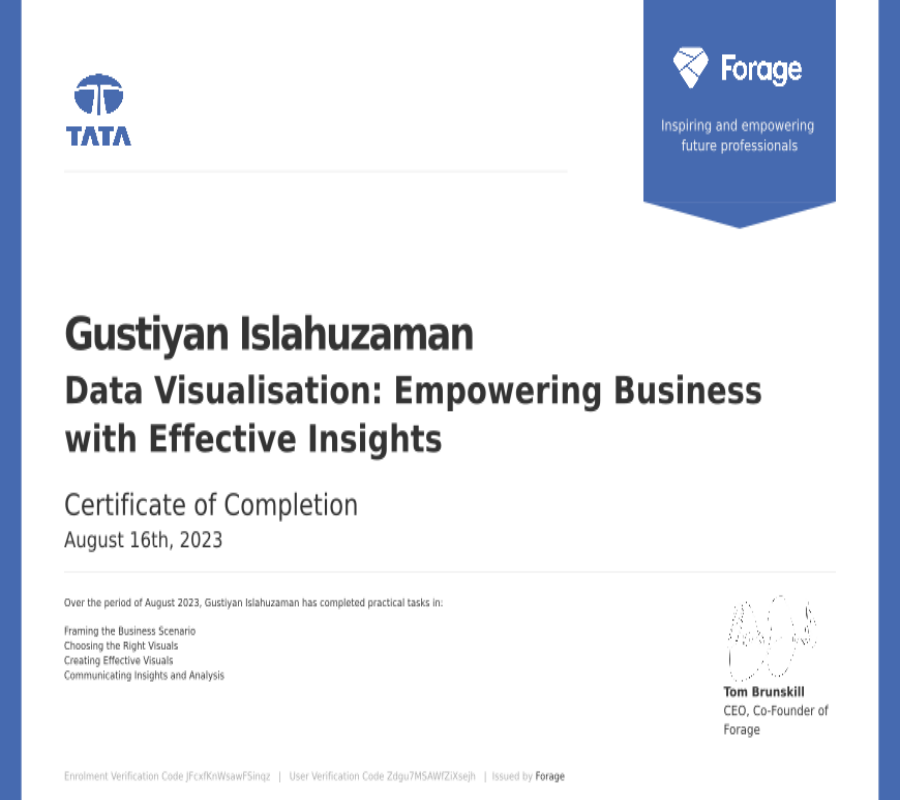
Certification

Showcasing my expertise with recognized certifications in data analysis and related fields. These certifications highlight my commitment to continuous learning and professional growth.

Blog

Discover tips and tricks to master Power BI, R, Python, SQL, and Excel for better data analysis. Let's dive into the world of data together!

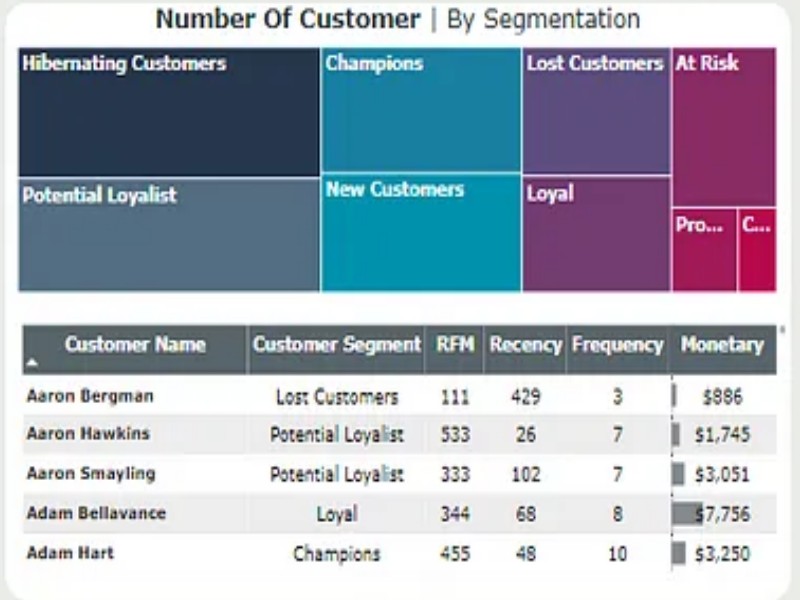
A Guide to RFM Analysis Using Power BI

In this guide, we’ll explore how to leverage the capabilities of Power BI to conduct RFM analysis.

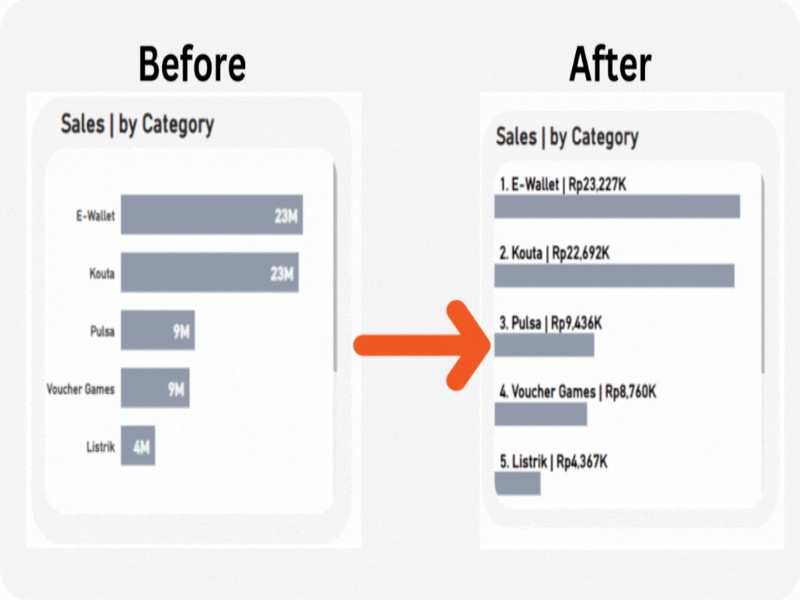
Enhance Your Power BI Bar Charts

This article will walk you through using DAX and a clustered bar chart to place custom labels above bars.

Predicting Product Labels in Python

In this article, I’ll walk you through a simple yet effective project where I used a Random Forest classifier to predict missing product labels.

Contact Me

Let's Connect! Whether you're seeking insights, collaboration, or have any inquiries, I'm here to engage opportunities with you.
Drop me a message and let's begin our conversation about data, analytics, and potential collaborations.